3PL — Consumer Package Goods LTL Optimisation
A Canadian 3PL operator engaged Borealis to assess Less-Than-Load (LTL) management for one of its consumer-package-goods clients — looking for room to improve service costs for new customers and to handle "network resets" as the CPG company's business changed. 9,000+ orders over twelve months were analysed; load consolidation, rail/truck combinations and "milk-run" trucking were modelled in ARTEMIS.
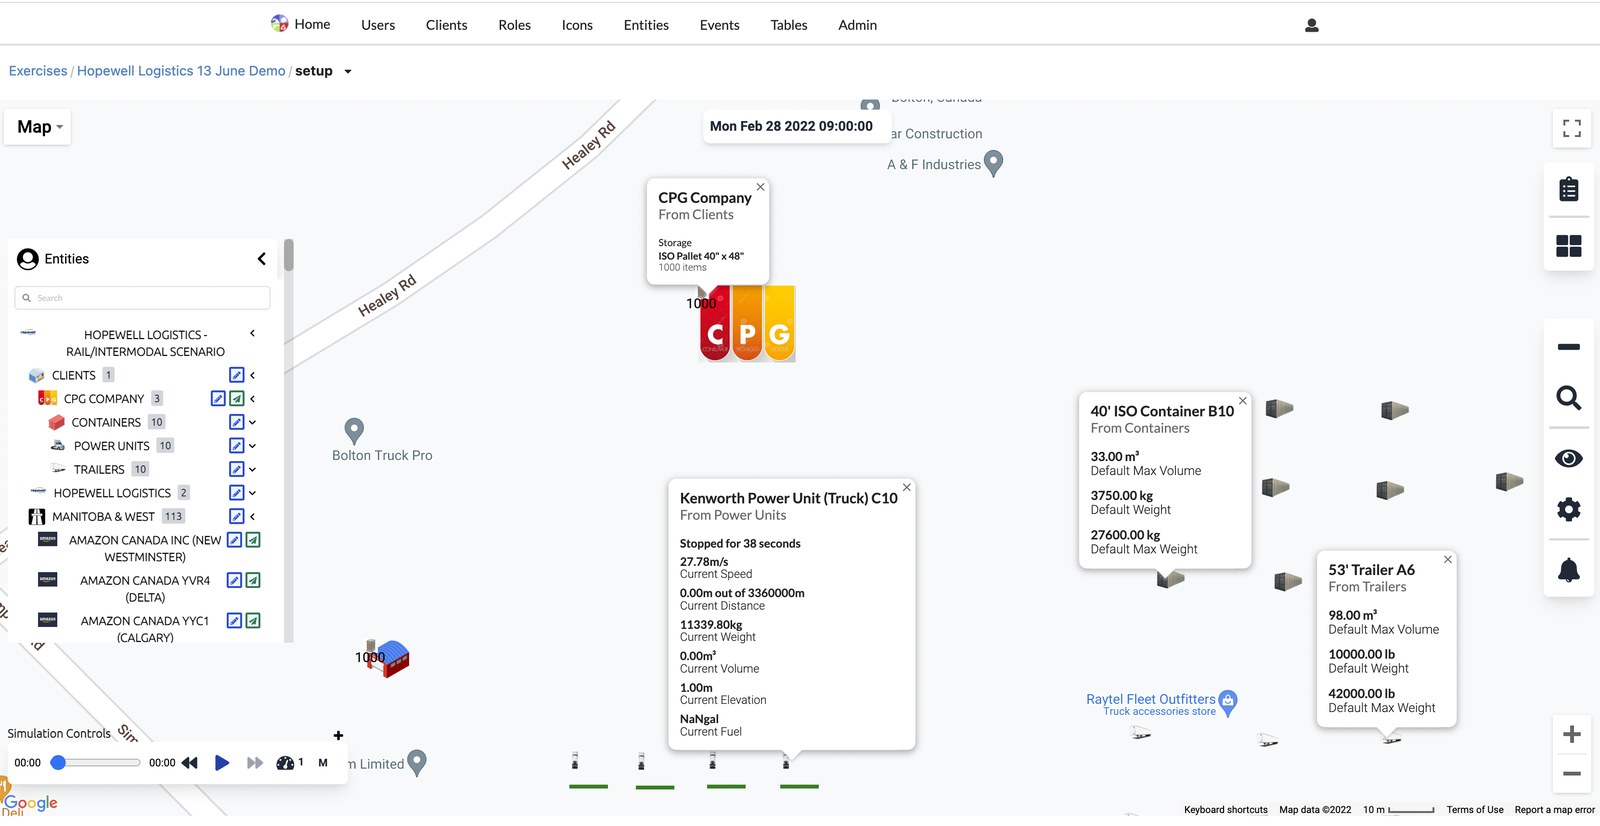
Borealis ran Exploratory Data Analysis and Simulation Planning on a one-year sample of 9,000+ orders covering requested delivery date, order date, ship date, delivery address, weight, volume and pallet counts. Working with 3PL management we focused first on the items with the highest cost/operational leverage — Requested Delivery Date variability and load combinations for truck and rail — and deferred the long-tail constraints (container stacking, refrigeration/dry/heated product mixing, weight/volume limits, trailer availability) to a later phase.
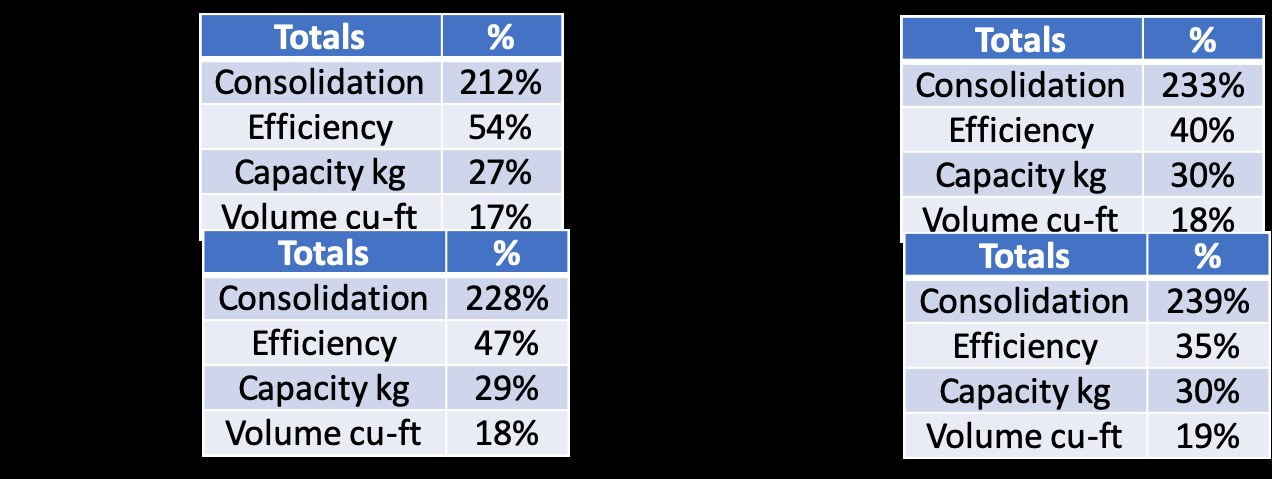
The consolidation model demonstrated 212% to 239% consolidation improvement across four tested load profiles, with 35-54% efficiency gains, against assumed pallet-stacking rules. Weight and volume were not the binding constraints in the dataset received — so additional, operationally-relevant rules should push consolidation further. Fewer shipments for the same demand translates directly into transport cost and delivery-time savings, and gives the 3PL a better story to take into customer contract conversations.
- 9,000+ orders analysed across twelve months
- 212-239% consolidation improvement on tested profiles
- 35-54% efficiency gain (load utilisation)
- Truck "milk-run" + rail-car combinations modelled end-to-end
- ARTEMIS scenario captured every order, mission, asset and destination
200%+ consolidation across four load profiles
Each table is one tested pallet-stacking / RDD-flexibility scenario. Consolidation is the reduction in shipment count for the same order set; efficiency is the resulting load utilisation. Capacity (kg) and volume (cu-ft) are reported to show that the gains were not constrained by weight or cube on this dataset — adding tighter, operationally-realistic rules in a follow-on phase should push these higher.
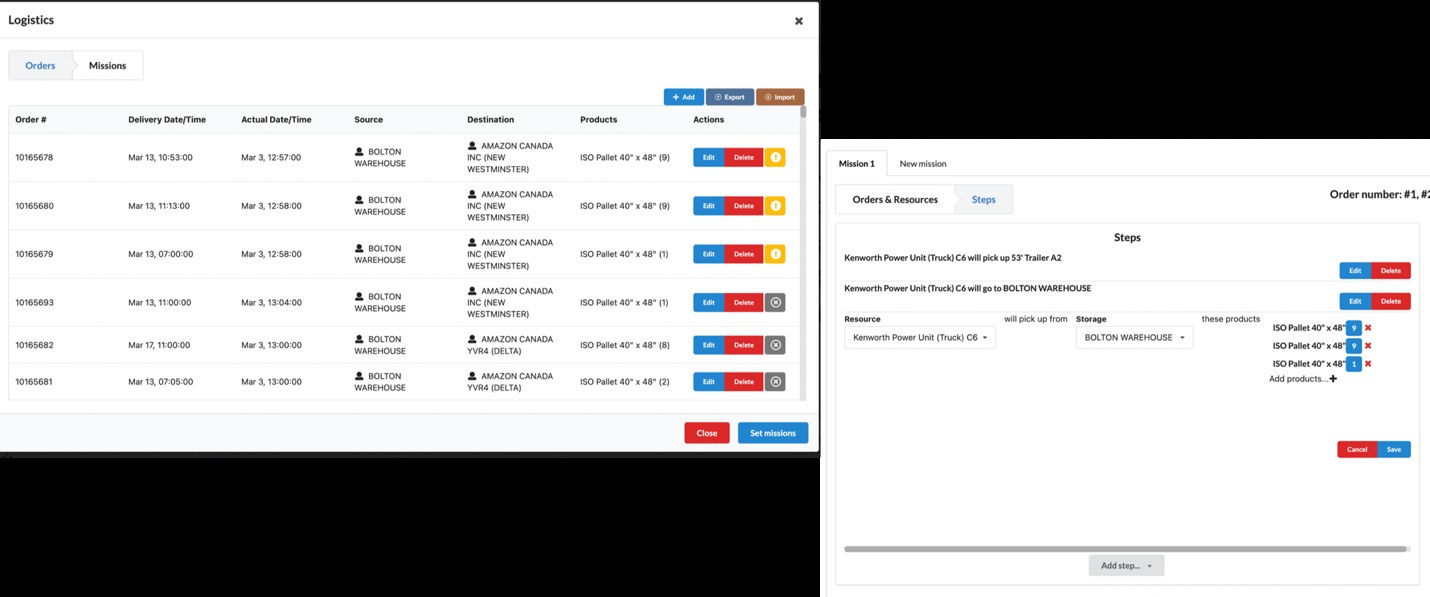
Orders, missions, and the physical plant
The same 9,000-order dataset drives the ARTEMIS scenario: every order becomes an entity with source, destination and product, and the simulation builds "missions" that assign power units, trailers and containers to satisfy those orders against the operational rules. The synthetic asset-performance data generated by each run is what supports network-reset planning, risk modelling and ROI analysis.
Recommended follow-on phases
- Pilot activity with detailed simulation of overall ROI and the customer's key value requirements.
- Data-analytics and simulation-based operational costing and improvements.
- Computer-simulation risk modelling and mitigation — historical data, synthetic data, trend & variance analyses, process improvement.
- Subscription Decision-Support Tool for supply-network resets and customer planning, focused on business-return metrics.
- Multi-factor simulation for training, process and procedure change-management.
- Integration of 3PL operations with the customer's data architecture — ERP interfaces, JSON / XML / XLS / CSV ingest, database and geodatabase integration, custom data management as required.